Anatomy Yr-1 |
||||||||||||||
 |
||||||
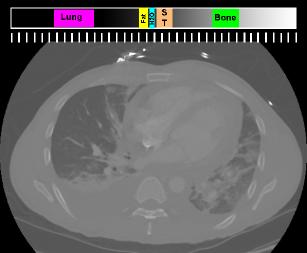
Image A is not a very nice looking CT image. Everything looks washed out. This is because the gray levels of the image are evenly distributed across the entire density spectrum. This is not a useful window, but can be called a "full dynamic range" image. When we look at CT images, we cluster the grey levels around a part of the spectrum we are interested in, as in the other examples. This does not require rescanning-it is the same data just displayed with different brightness and contrast settings.

A
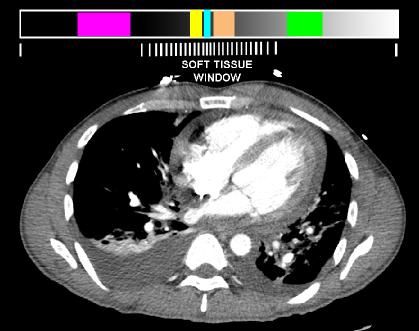
The soft tissue window in Image C shows many more findings than can be seen on Images A, B or D. Note that fat and muscle are very different shades of gray. Fat outlines many soft tissue structures and makes them easier to see.

B
C

D
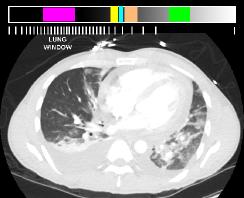
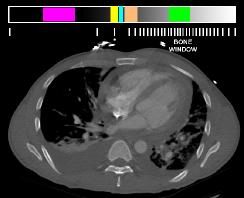
Image B is only good for looking at air and lungs. You can't see much of the soft tissue differences because not many shades of grey are devoted to that part of the spectrum. Image D shows internal detail in every bone that is not seen on the other windows.